
 Facebook
 X
X
 Pinterest
 Copy Link

The following analysis of the Oregon and Southwest Washington real estate market is provided by Windermere Real Estate Chief Economist Matthew Gardner. We hope that this information may assist you with making better-informed real estate decisions. For further information about the housing market in your area, please don’t hesitate to contact your Windermere Real Estate agent.
REGIONAL ECONOMIC OVERVIEW
The recovery of the jobs lost due to the pandemic continued in the second quarter, but at a significantly slower pace than in the first quarter. Of the more than 285,000 Oregon-based jobs shed during the pandemic, 181,800 have now returned. Though this is positive, state employment is still down more than 100,000 jobs. As I predicted last quarter, it is now clear that Oregon’s efforts to pull back on reopening due to rising COVID-19 cases slowed the velocity of the job recovery, but there was growth in the second quarter.
In Southwest Washington, 16,980 of the more than 22,000 jobs that were lost have returned, and they are returning more quickly than in Oregon.
More hiring has allowed the unemployment rate in Oregon to drop from 6% at the end of the first quarter to 5.6% in June. The jobless rate in Southwest Washington currently stands at 6%, its lowest level since the pandemic took hold.
OREGON AND SOUTHWEST WASHINGTON HOME SALES
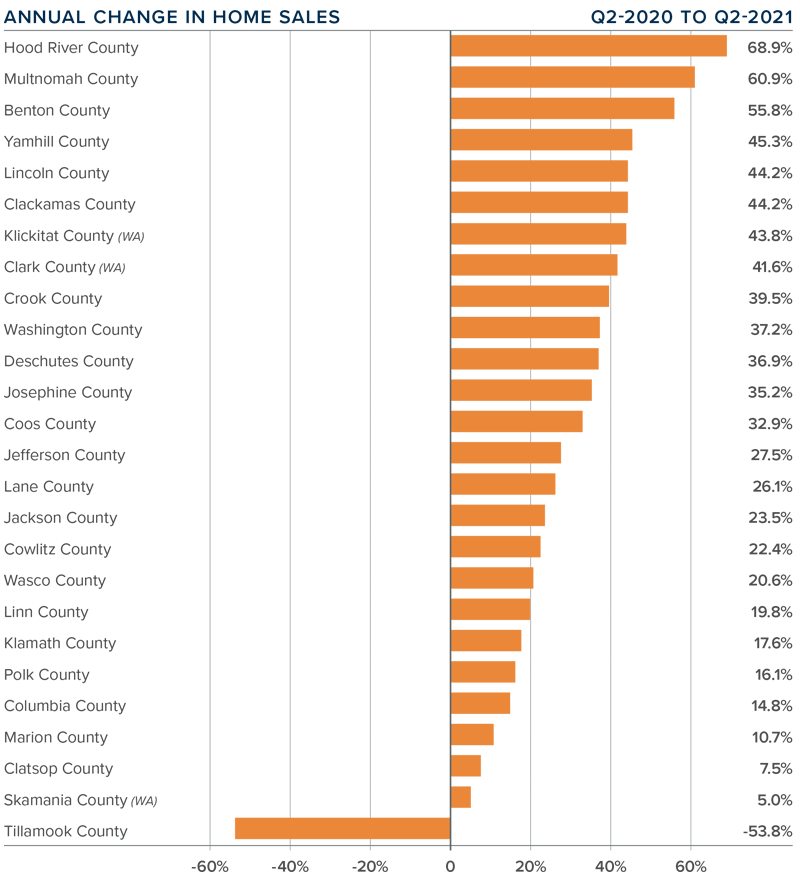
❱ In the second quarter of the year, 19,614 homes sold, an increase of 37% from the second quarter of 2020. Although an increase was certainly expected given where we were last year, I was also very pleased to see a 59% increase in sales from the first-quarter figure.
❱ The largest increase in sales from the first quarter was in the greater Portland metro area, but all counties contained in this report experienced more transactions.
❱ Sales rose in every county other than Tillamook compared to a year ago, but this is a very small market that regularly experiences extreme swings in the number of sales. In markets where sales rose, all but two of them saw double-digit gains.
❱ Demand remains strong but supply is still lagging. More buyers are getting off the fence after mortgage rates rose in the first quarter. Although rates have pulled back somewhat, the specter of them rising has generated a lot of competition for the homes that are available.
OREGON AND SOUTHWEST WASHINGTON HOME PRICES
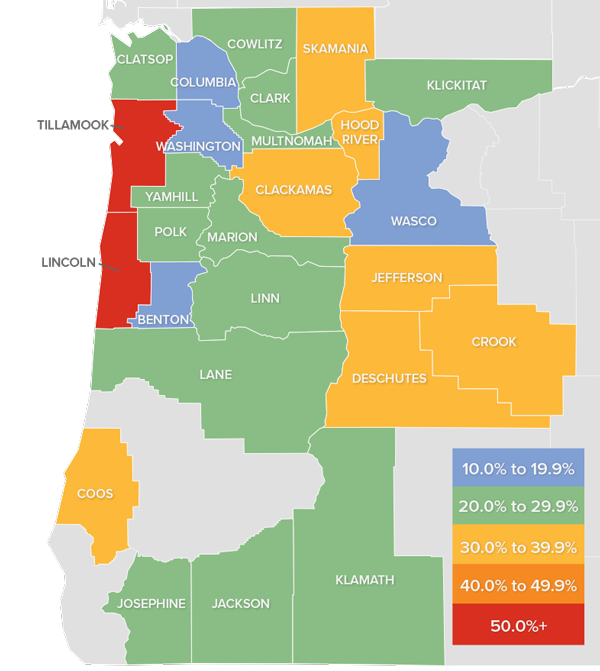
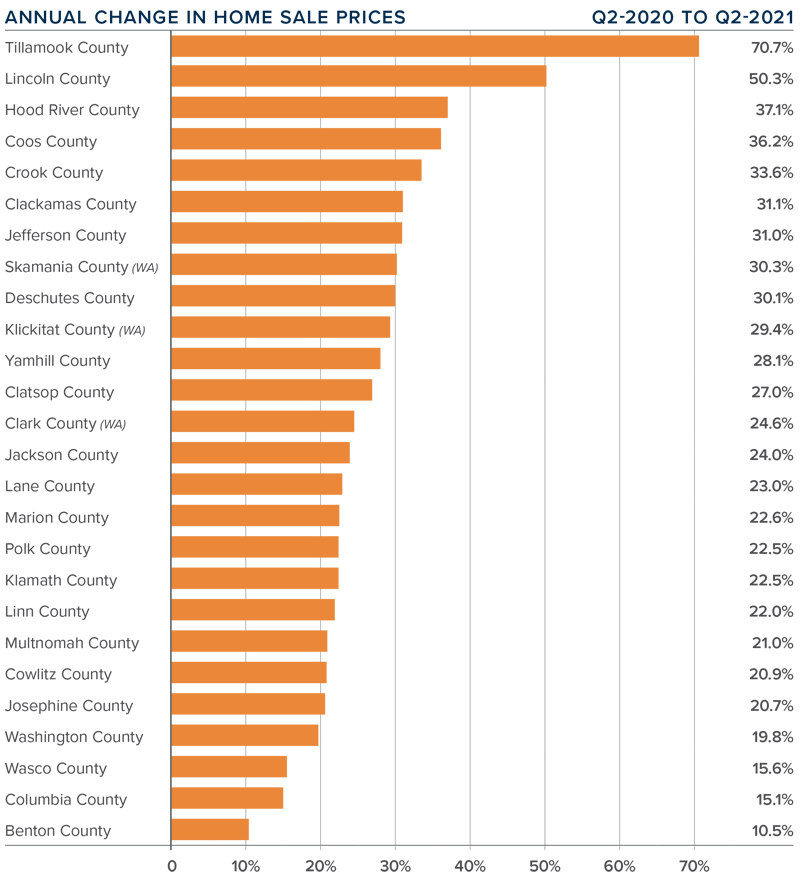
❱ The average home price in the region continues to soar. Prices were up 26.1% year over year to $532,397 and were 5.8% higher than in the first quarter of the year.
❱ Relative to a year ago, Tillamook County again led the market with the strongest annual price growth, but it is a very small market prone to significant swings. The most expensive market was Hood River County, where the average sale price was $728,700.
❱ All counties contained in this report saw prices rise more than 10%. Prices in Jackson, Klickitat, and Wasco counties were lower than in the first quarter, but I do not see this as being pervasive and I expect them to pick back up as we move through the rest of the year.
❱ Prices continue to rise at an astonishing pace, but many areas are hitting an affordability ceiling. This, in concert with modest increases in mortgage rates, is likely to temper price growth—but just not yet. This year, prices will continue to increase at well above the long-term average.
DAYS ON MARKET
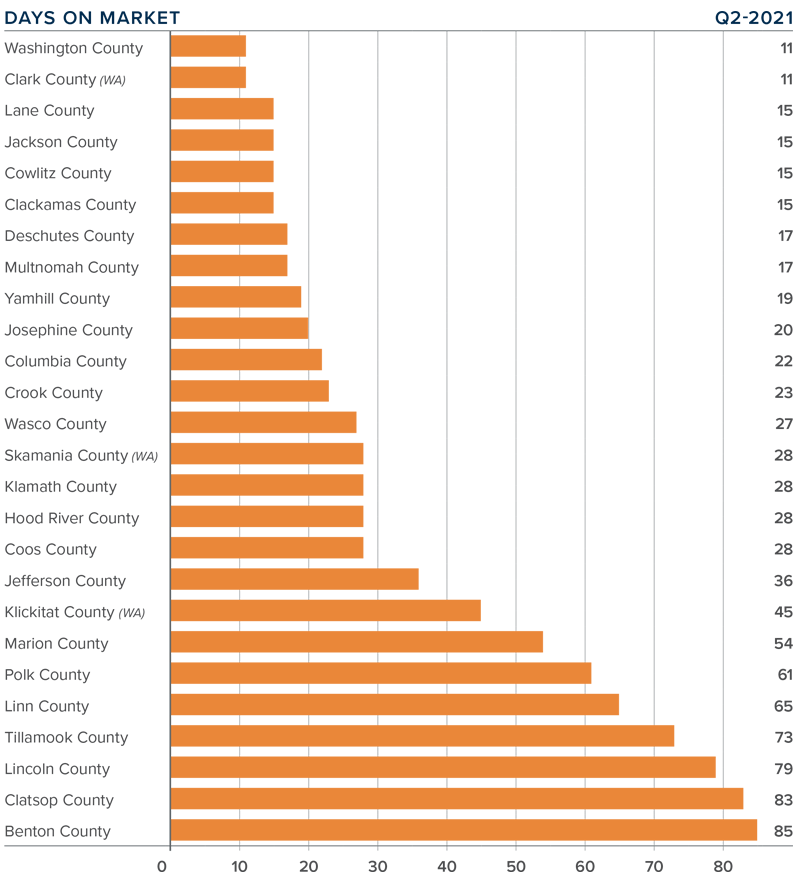
❱ The average number of days it took to sell a home in the region dropped 30 days compared to the second quarter of 2020. It took 16 fewer days to sell a home compared to the first quarter of this year.
❱ The average time it took to sell a home in the second quarter of 2021 was 35 days.
❱ With the exception of Benton County, which was up nine days, every county saw the length of time it took to sell a home drop compared to a year ago. Benton was also the only county that saw market time rise compared to the first quarter of 2021.
❱ Homes again sold the fastest in Washington County, where it took only 11 days for the average home to go under contract. An additional 16 counties saw the average market time drop to below a month.
CONCLUSIONS
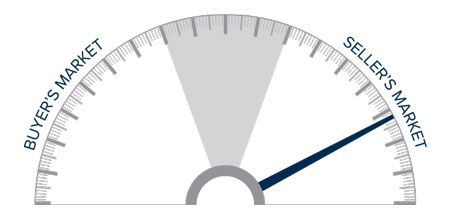
This speedometer reflects the state of the region’s real estate market using housing inventory, price gains, home sales, interest rates, and larger economic factors.
Home sales continue to grow, and robust demand is causing prices to rise significantly, resulting in a market that strongly favors sellers. The additional supply of homes that I’m predicting for 2021, combined with modestly rising interest rates, may start to slow the momentum in price growth, but for now I have moved the needle further in favor of sellers.
ABOUT MATTHEW GARDNER

As Chief Economist for Windermere Real Estate, Matthew Gardner is responsible for analyzing and interpreting economic data and its impact on the real estate market on both a local and national level. Matthew has over 30 years of professional experience both in the U.S. and U.K.
In addition to his day-to-day responsibilities, Matthew sits on the Washington State Governors Council of Economic Advisors; chairs the Board of Trustees at the Washington Center for Real Estate Research at the University of Washington; and is an Advisory Board Member at the Runstad Center for Real Estate Studies at the University of Washington where he also lectures in real estate economics.
